Tutorial - Testing and Debugging Android App with Google Chrome

Notes

  1. Before reading this tutorial, please make sure that you have set up your environment properly for building and testing apps. Read Installing Google USB Driver and Setting up a Device for Development in Preparing Windows for Android App Development first.
  2. Read Get Started with Remote Debugging Android Devices first.
  3. Make sure your Android device can be discovered by Chrome first. Requires Android 4.4 or newer. If your device cannot be detected, see Troubleshooting: DevTools is not detecting the Android device first.

In this tutorial we will show you how to test and debug your app using Google Chrome. We will use the demo project/database for demonstration.
 

1. Open and configure the demo project
  • Load DB AppMaker and open the demo project, (If you have not downloaded the demo project yet, please download from DB AppMaker Demo first, then unzip it and follow the instructions in the readme.txt.)
  • Go to the Database tab, enter the connection information of the demo database
  • Click Tools -> Synchronize to synchronize with the demo database
2. Generate and run the app

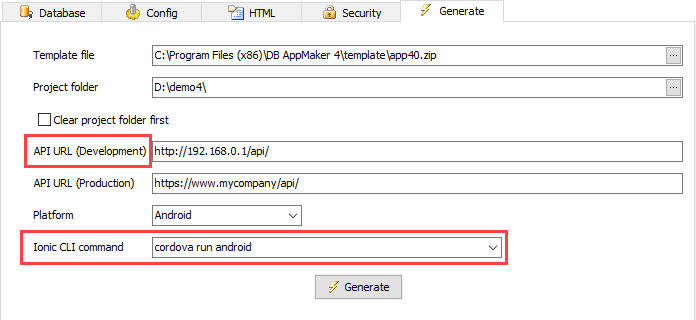
  • Go to the Generate tab,
  • Change the Project folder to where you want to generate, using a folder without permission concerns is recommended, e.g. D:\demo4,
  • Set the API URL (Development) to the URL that you have set up for testing, e.g. http://192.168.0.1/api/,
    Note By default the API folder is generated under <project folder>\api (e.g. D:\demo4\api), make sure you set up your web server to serve the API.
  • Set the Platform as "Android",
  • Set the Command as cordova run android,
  • Plug your mobile device to your PC with an USB cable,
  • Make sure your PC is connected to the internet, then click the Generate button.

After DB AppMaker generating the scripts, the Ionic CLI will try to compile the app, this may take several minutes, be patient, wait until the generation is completed.

3. Run the app on mobile device

The app should be running on your mobile device.

4. Open Google Chrome on your PC

On your desktop Chrome browser, navigate to chrome://inspect. Confirm that Discover USB devices is checked:

Discover USB Devices in chrome://inspect

Tip You can also get to chrome://inspect by selecting Chrome menu > More tools > Inspect Devices.

On your device, an alert prompts you to allow USB debugging from your computer. Tap OK.
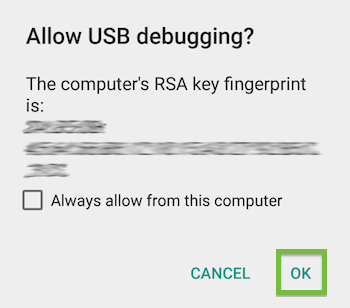
USB debugging permission alert

Tip To skip this alert in the future, check Always allow from this computer.

The message USB debugging connected displays in the device’s notification drawer.

Note During remote debugging, Chrome prevents your device's screen from going to sleep.

Now you are ready to debug your site in a browser tab. On your computer, the chrome://inspect page displays every connected device, along with its open tabs. To start debugging, click inspect below the browser tab you want to debug.
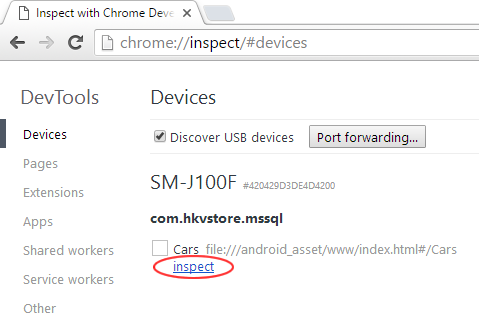
The chrome://inspect page.

A new instance of Chrome DevTools launches on your computer. From this instance, you can interact with the selected browser tab on your device in real time.

For example, you can use DevTools to inspect web page elements on your device:

  • When you mouse over an element in the Elements panel, DevTools highlights the element on your device.
  • You can also click the Inspect Element inspect element icon icon in DevTools and tap your device screen. DevTools highlights the tapped element in the Elements panel.
Note The version of Chrome on your device determines the version of DevTools used during remote debugging. For this reason, the remote debugging DevTools might differ from the version that you normally use.

To test the various features of DB AppMaker, you can make changes to the demo project, re-generate scripts and repeat step 2-4 described above.


 ©2016-2021 e.World Technology Limited. All rights reserved.